
Optimism post debt-ceiling deal
Will it last?

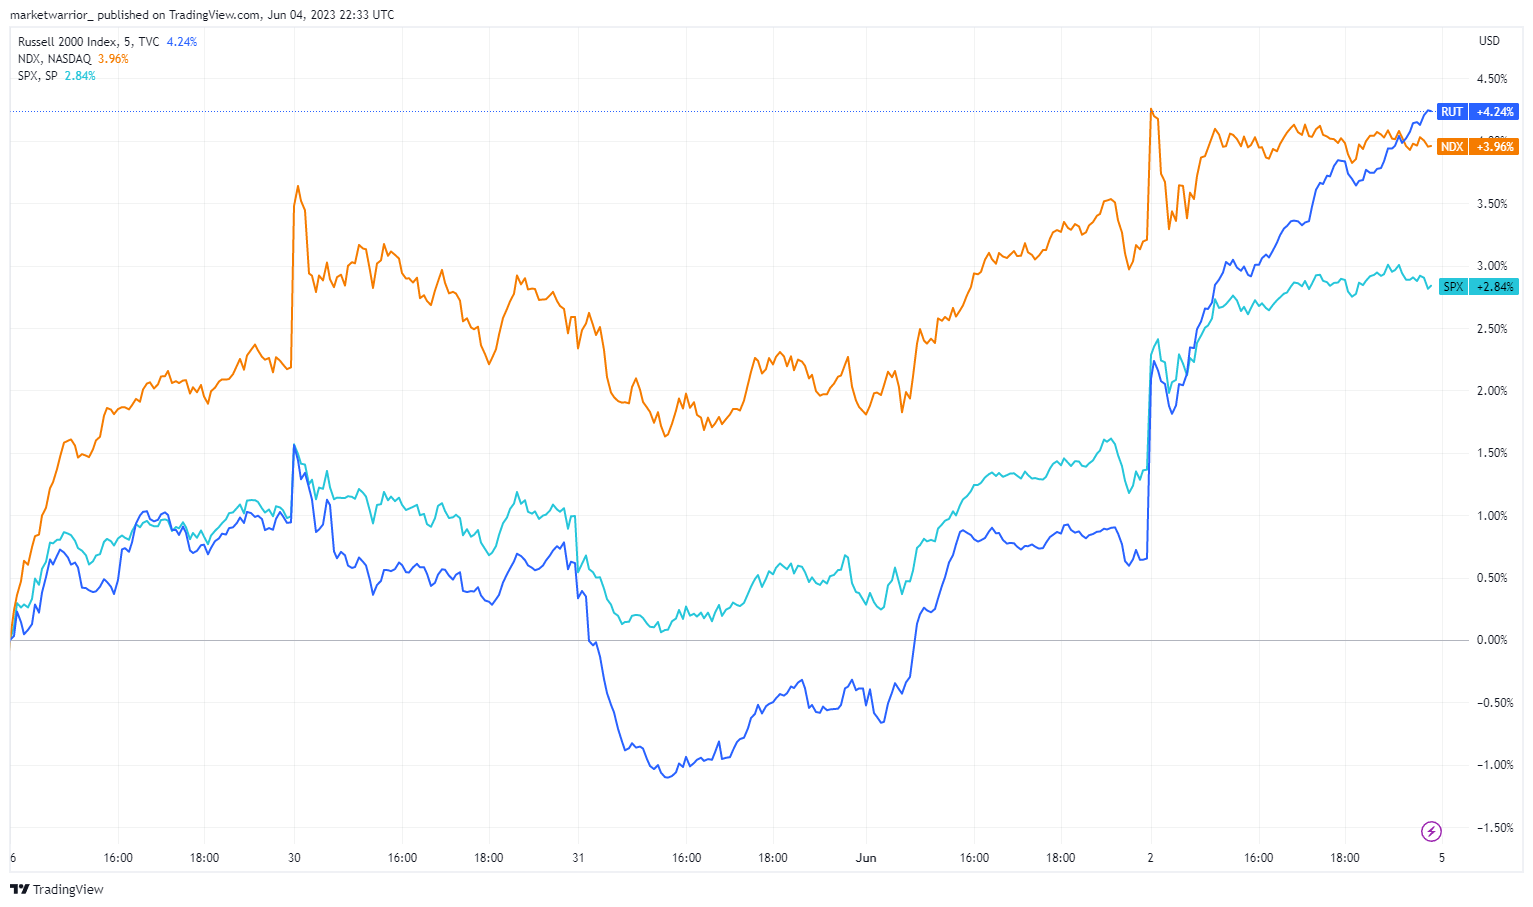
Markets rallied last week, with the S&P 500 and Nasdaq 100 indices closing at 9-month and 14-month highs, respectively. However, the small-cap index, Russell 2000, outperformed both indices over the last week.
The passage of the debt ceiling deal through Congress, the prospect of the Fed “skipping or pausing” at the next meeting, and signs of inflation (on the goods side) still falling led to a rally in risk assets.
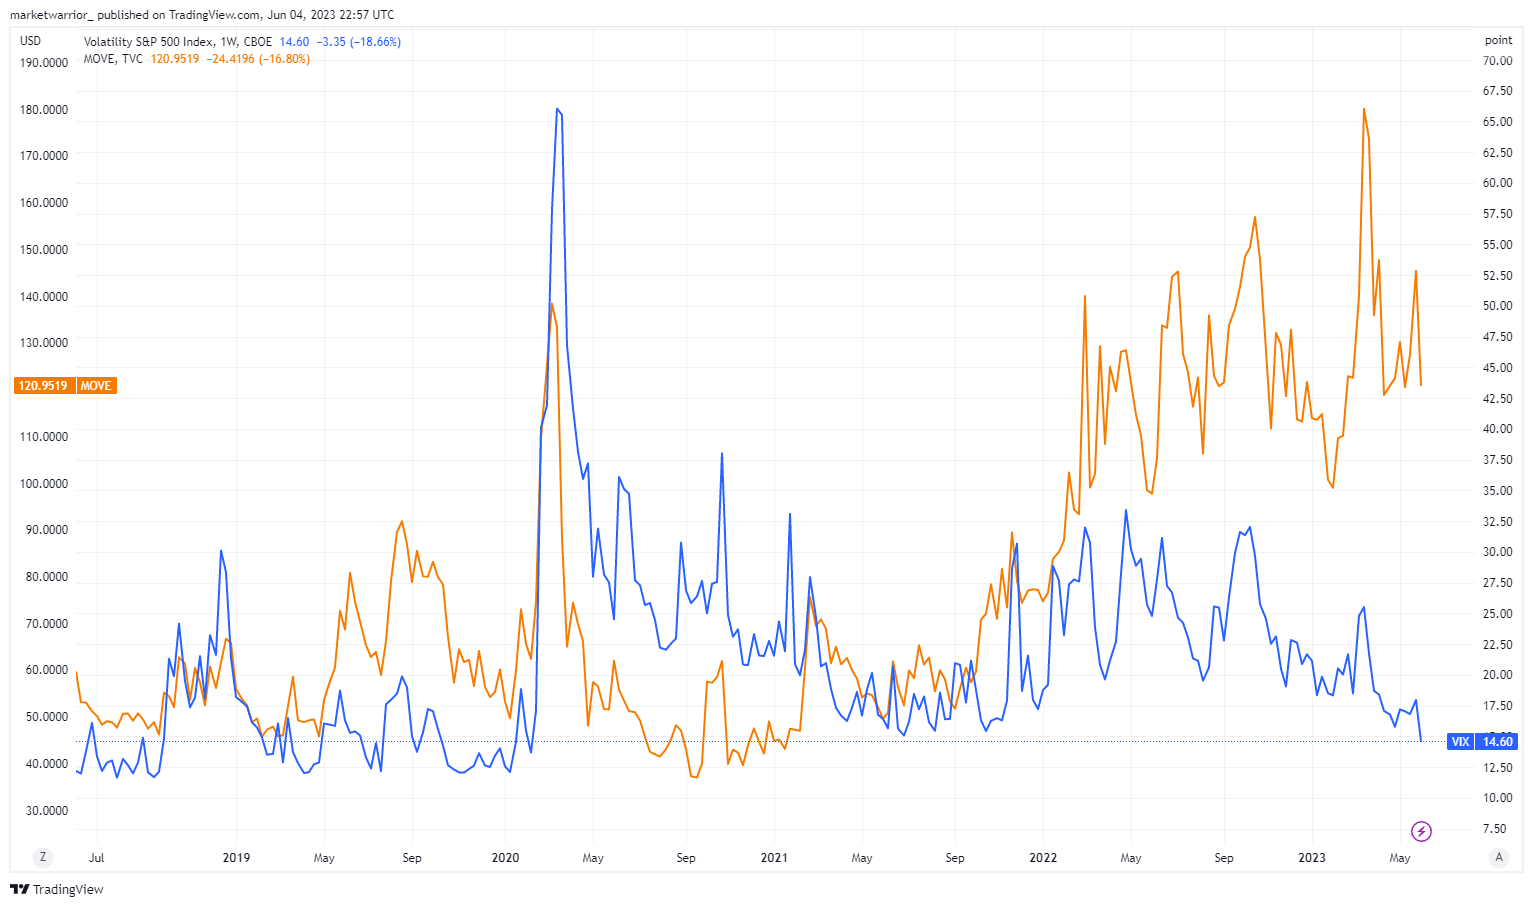
The VIX index also declined to the 14 handle. The VIX is a volatility index that measures market expectations for future price fluctuations, often called the "fear index" in finance. Meanwhile, the MOVE index, which measures Treasury bond volatility, is still at an elevated level when compared against the VIX.
As you read the note further, you will know more about the market narrative last week, which was disinflation (also noted by Brent Donnelly here Friday Speedrun ) and optimism over Fed potentially skipping the June hike. However, I want to remind readers that the core inflation in the US remains high, and the labor market is tight. Note that we will receive the next US CPI report on June 13th, and the Fed would definitely take that into consideration when communicating its Summary of Economic Projections, which could be considered as their forward guidance. Even WSJ’s Nick Timiraos has noted in his latest article that “A continuing strong labor market could lead officials to raise rates higher than anticipated.”
Also, as stated last week, banking stresses have calmed in recent weeks, and we haven’t seen a fallout in economic activity. Positioning in the S&P 500 is still bearish, but it is very bullish in NASDAQ. Perhaps time to take profits in NASDAQ?
US ISM Manufacturing
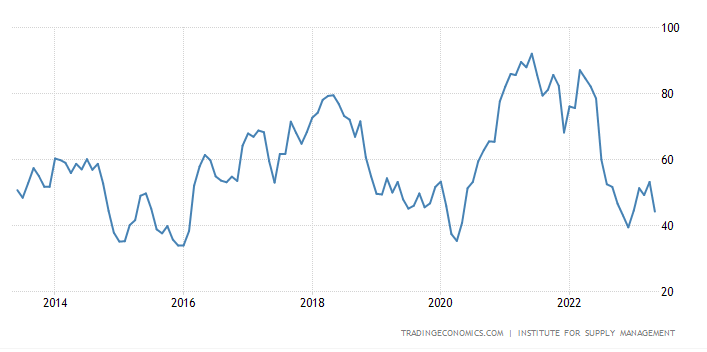
Investors overlooked the fact that the latest US ISM manufacturing reading remained in the contractionary territory at 46.9 (vs. 47.0 expected). Instead, a sharp decline in the prices paid component of the US ISM manufacturing report was seen as good news on the inflation front. The prices paid component of the manufacturing ISM was far beneath expectations at 44.2 (vs. 52.3 expected). Further, the employment component ticked up to a 9-month high of 51.4. In addition, optimism over China’s stimulus to boost the economy combined with the above factors led to small-cap stocks outperforming last week.
US ISM Manufacturing Prices Paid Index
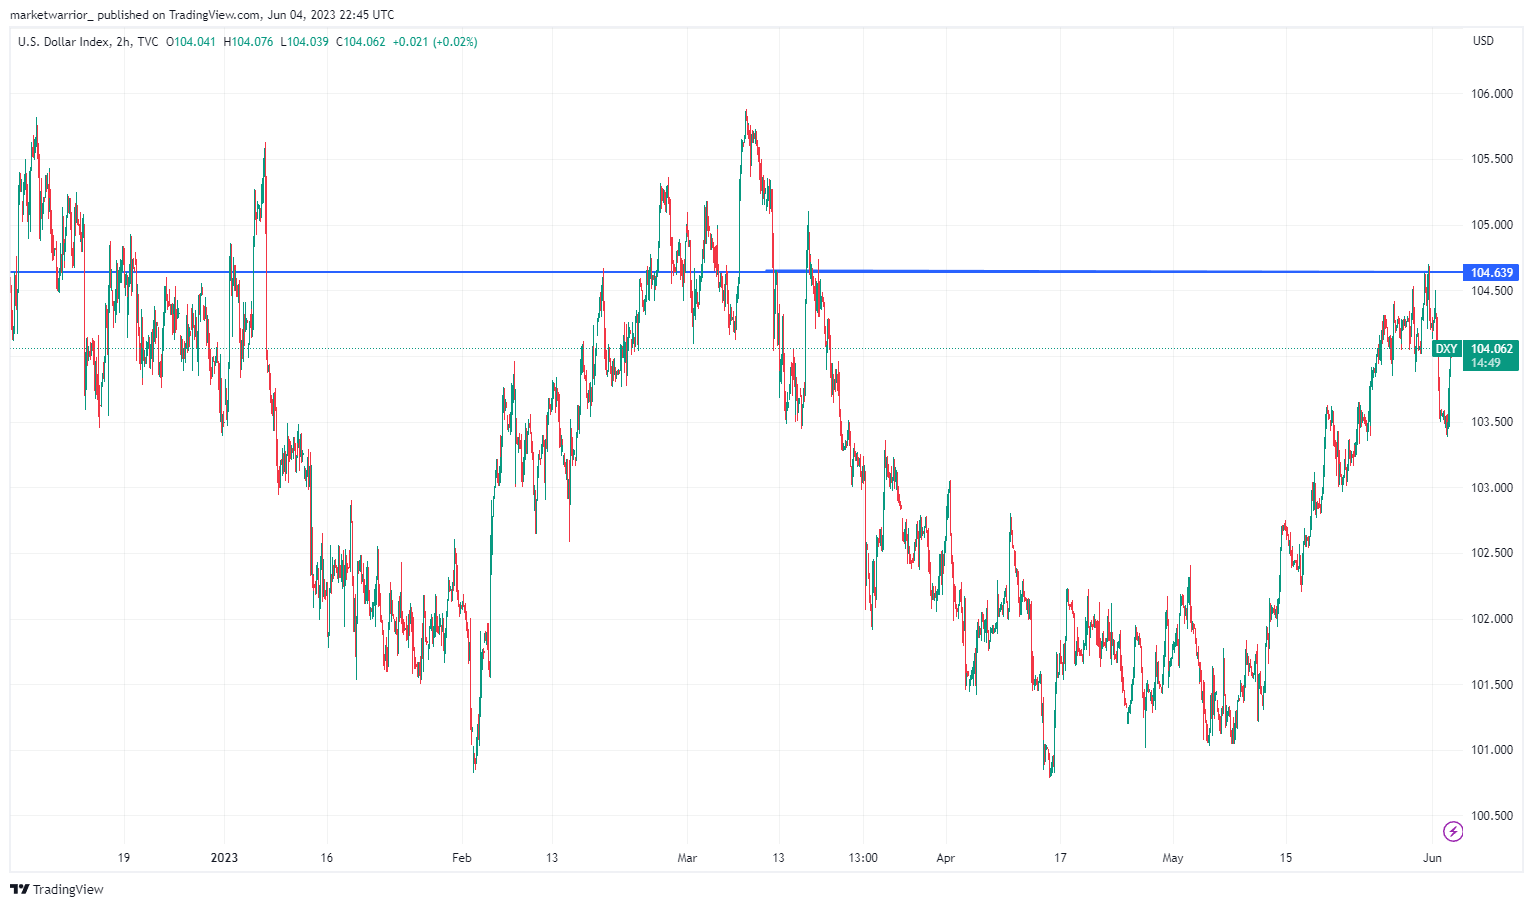
USD
Interestingly, the USD bounced off the blue line marked last week, which was the level we saw right before SVB went under. It continues to be an important level to watch.
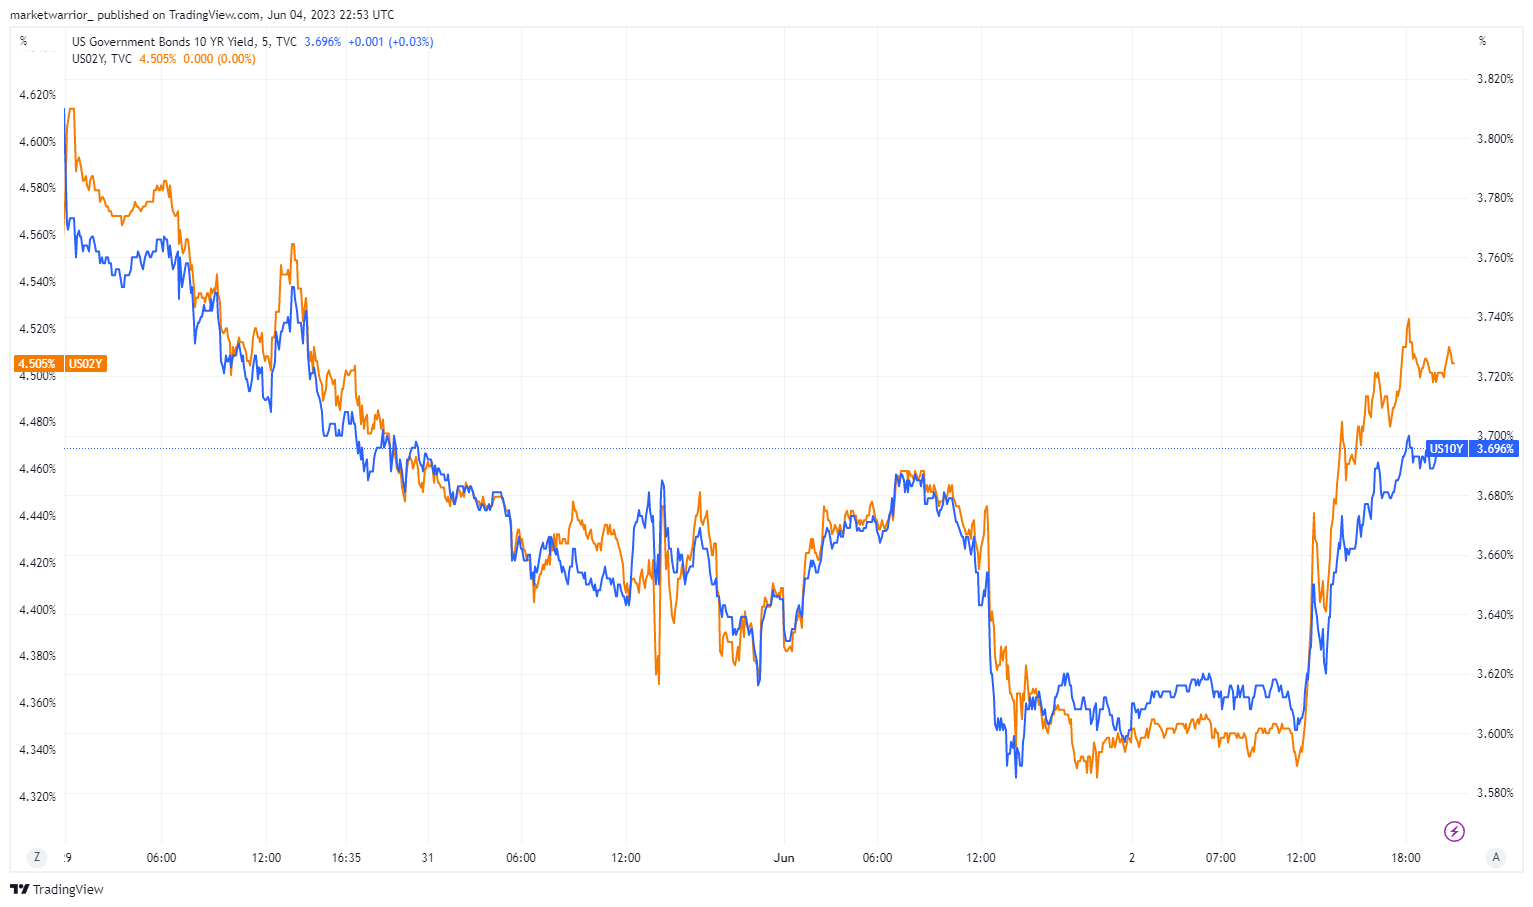
Treasuries
Last week we saw a strong rally in Treasuries (until Friday). The rally started with the sovereign bonds in Europe before spilling over to the US.
Eurozone Inflation and Unemployment Data
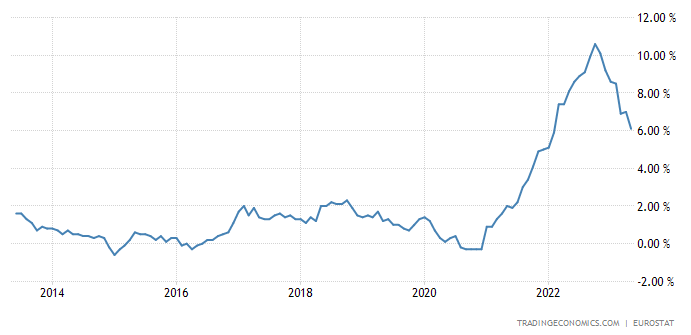
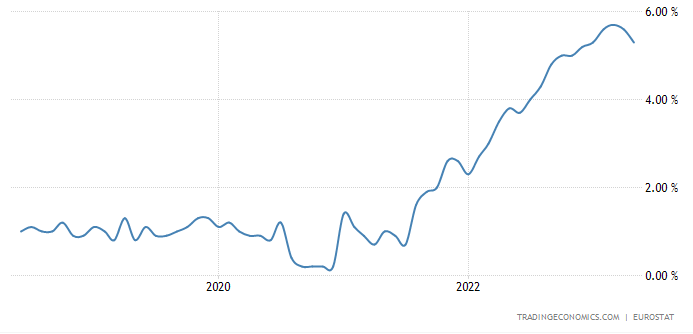
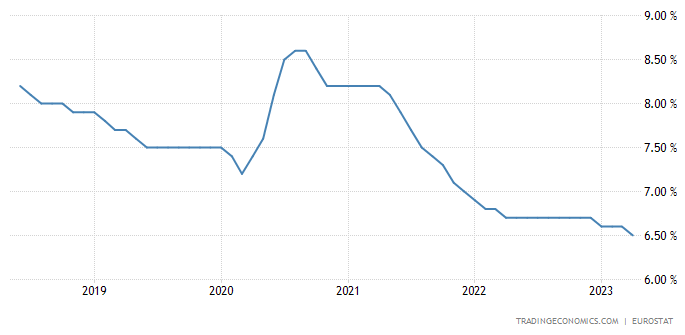
Weaker-than-expected CPI prints in Spain, Germany, and France led to a rally in Eurozone bonds. The flash CPI estimate for May fell to a 15-month low of +6.1% (vs. +6.3% expected), and core inflation was down for a second month running to +5.3% (vs. +5.5% expected). The Euro Area unemployment rate also fell to its lowest since the formation of the single currency in April, at 6.5%.
Euro Area Inflation Rate
Euro Area Core Inflation Rate
Euro Area Unemployment Rate
The prices paid component of the US ISM report, mentioned above, along with Fed speakers pushing to skip a June hike, also contributed to a rally in Treasuries. Overall, investors became less concerned that the Fed would continue to hike aggressively. However, the US jobs report reversed the narrative on Friday.
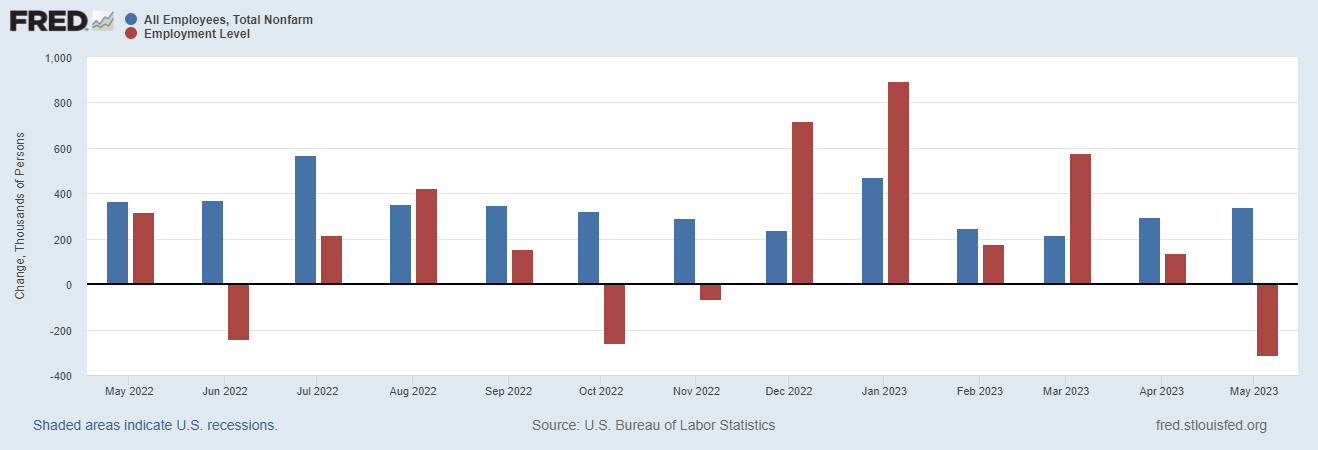
US Jobs report (aka Non-Farm Payrolls)
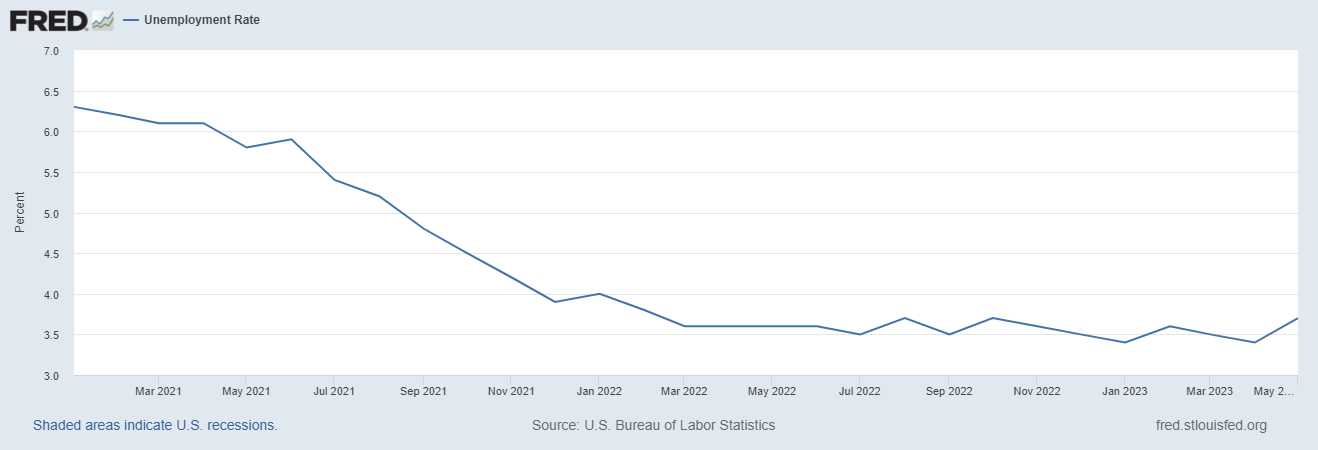
The jobs report released on Friday for May showed that 339k jobs (blue bar in the graph below - establishment survey) were added, highlighting a resilient labor market, despite the unemployment rate jumping to 3.7% from 3.4%. The rise in the unemployment rate was due to a decline in employment in the household survey (red bar below). Note that the establishment survey employment (payrolls - blue bar) is a more reliable indication of trend job growth. A one-month decline in volatile household survey employment following months of strength is unlikely to last. To see the volatility in the household survey, click here.
From the WSJ: Friday’s report was the 14th-straight time payroll growth has exceeded Wall Street forecasters’ estimates. Given that streak, “it is hard not to conclude that the labor market just has more momentum than standard models suggest,” said Krishna Guha, vice chairman of Evercore ISI, in a report Friday.
But the contradictory data from the two Labor Department surveys, which can occur at times when economic growth is slowing, “offers a rationale for skipping June with a default to hike again in July unless the data shows more signs of cooling by then,” he said.
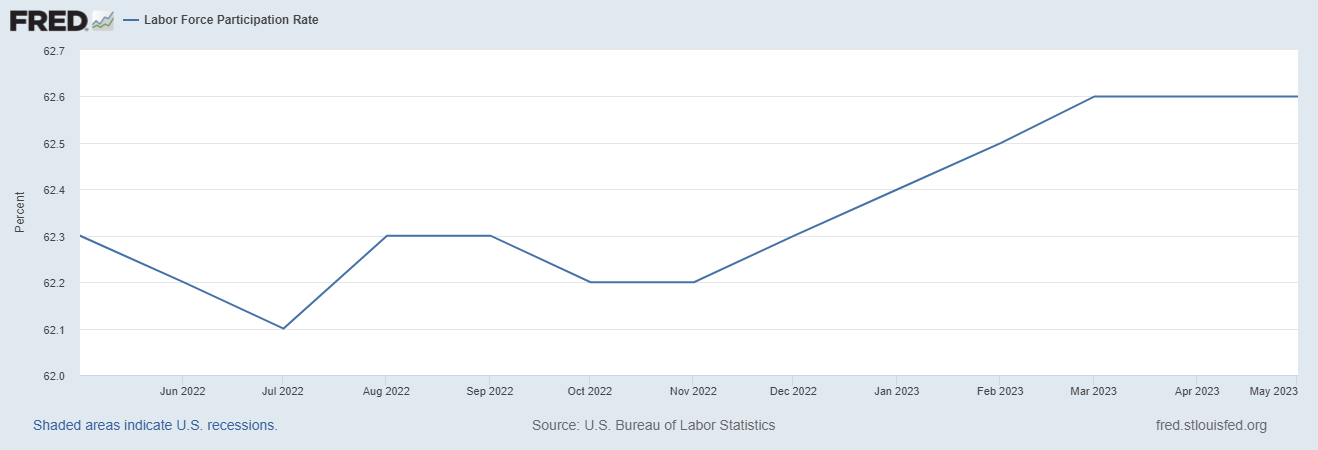
Labor force participation rate remained steady
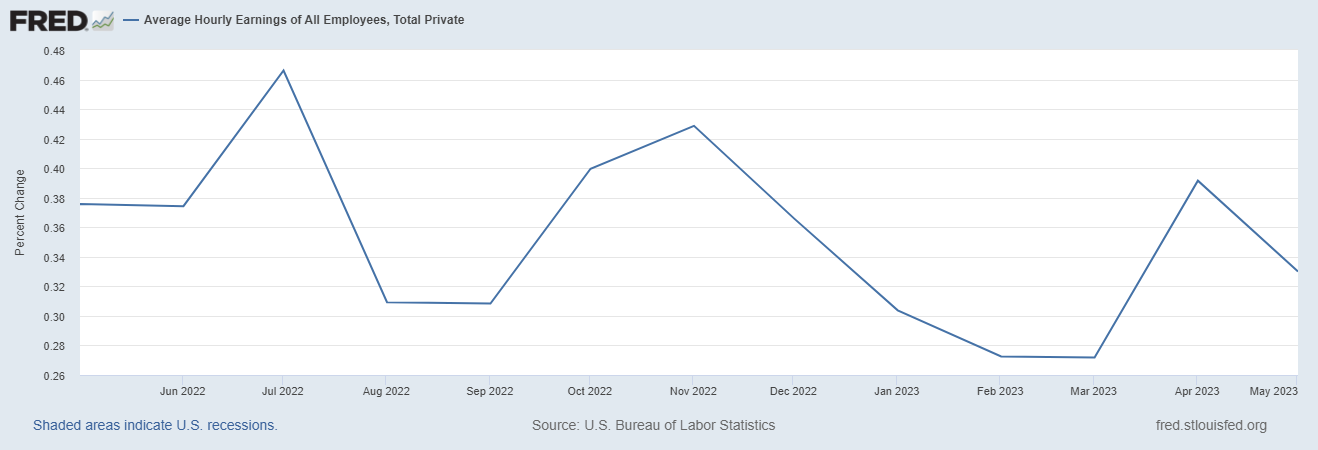
The month-over-month average hourly earnings declined slightly.
Fed funds pricing
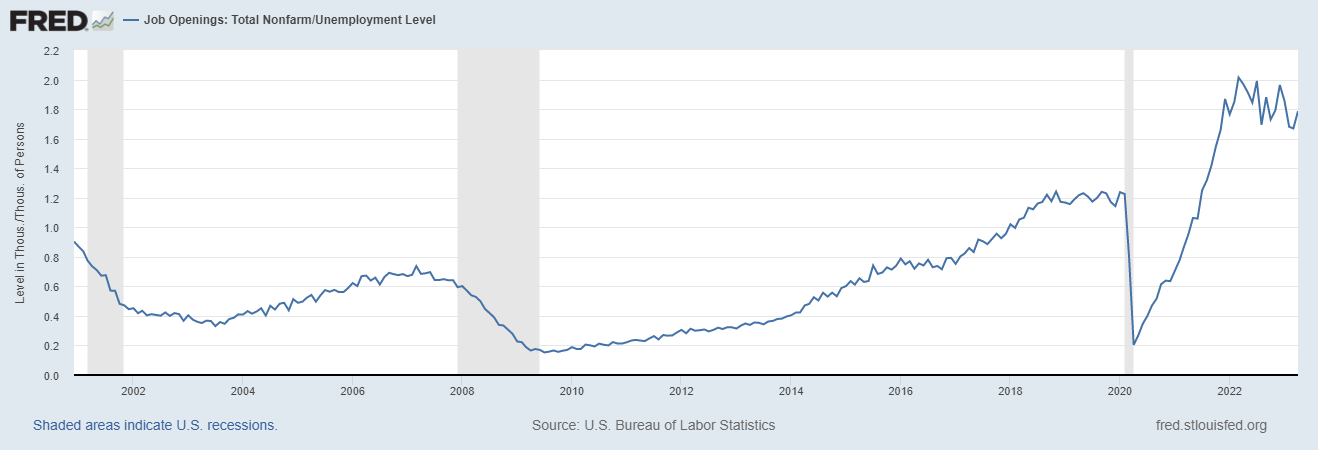
The fed funds pricing showed a 70% probability shortly after the JOLTS release as the report contained more bad news from the Fed’s perspective. The main headline was a big increase in job openings, which unexpectedly rose to a three-month high of 10.103m (vs. 9.4m expected), and the previous month’s openings were revised up as well. In turn, this meant that the ratio of vacancies per unemployed people went back up to 1.79, having been at a 16-month low the month before. So that’s further evidence that the US labor market remains very tight by historic standards.
However, comments from Fed voters Philly Fed’s Harker and Fed Governor Jefferson - who was recently nominated to be Fed vice chair - on skipping a rate hike led to a sharp move in Fed Fund Pricing.
Governor Jefferson noted that, “skipping a rate hike at a coming meeting would allow the Committee to see more data before making decisions about the extent of additional policy firming.”
President Harker noted that he was “definitely in the camp of thinking about skipping any increase at this meeting,” before adding that “If we’re going to go into a period where we need to do more tightening, we can do that every other meeting.”
WSJ’s Nick Timiraos, aka “Fed whisperer” also gave his blessings on keeping rates steady at their June meeting. This led to investors paring back their bets for a hike to 31% by the end of the week.
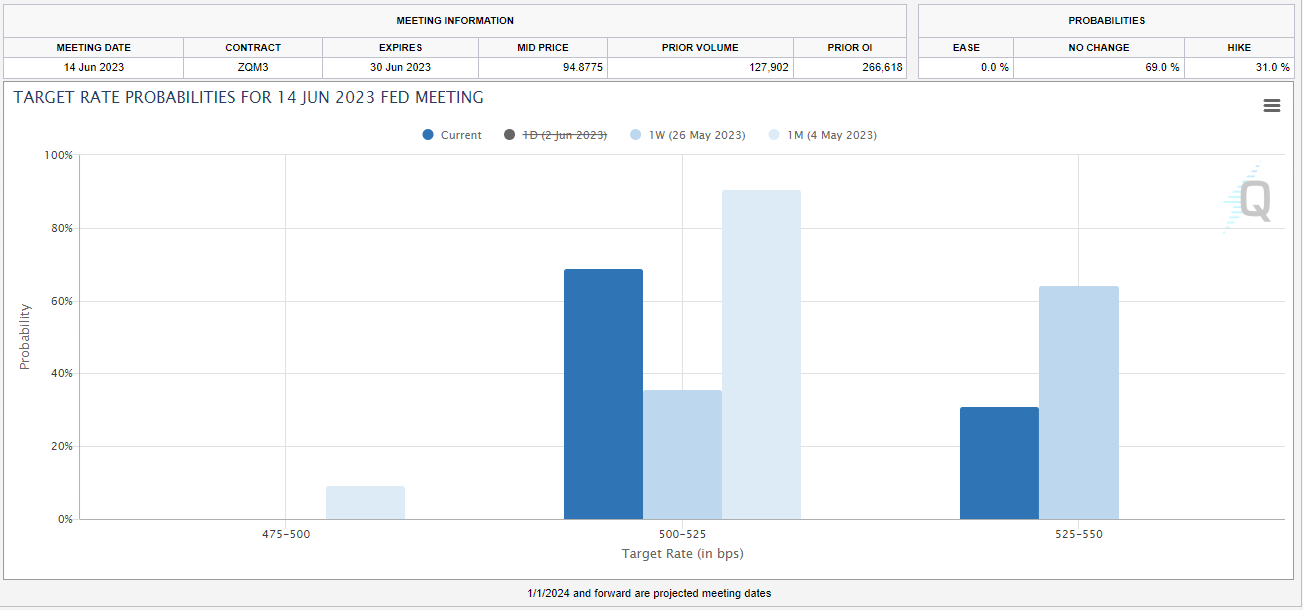
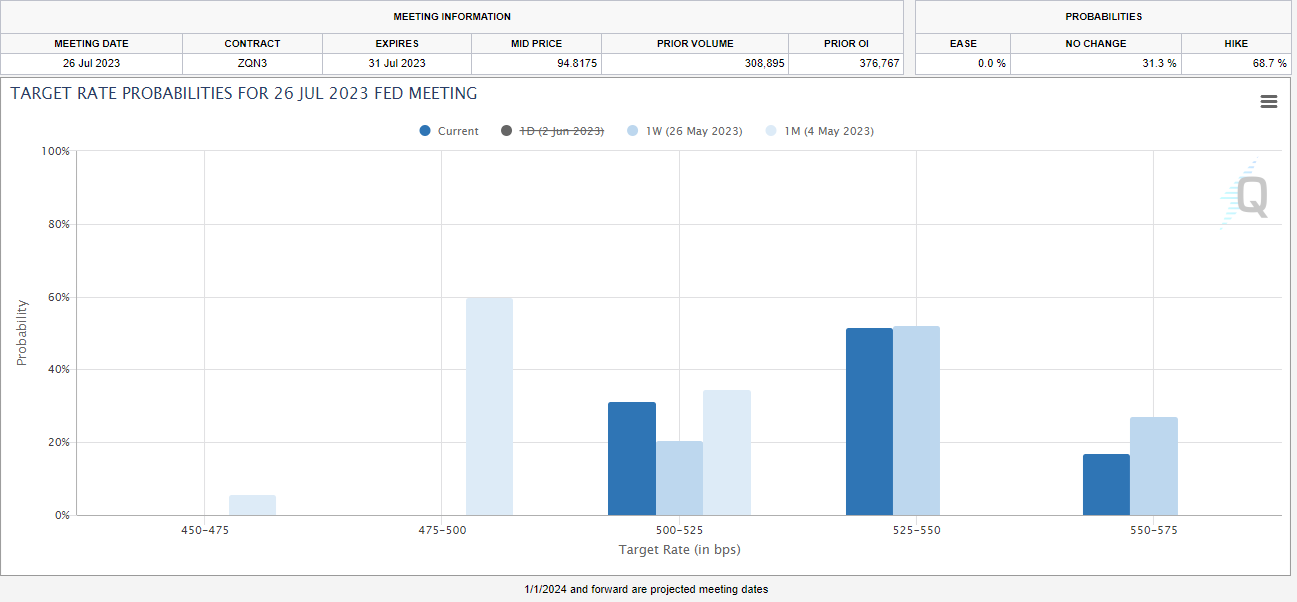
Investors are still expecting a hike in July, though, with odds at 69% at the end of the week. This is interesting as the odds for keeping the rates at 475-500bps were at 60% just last month. ie, the market expected the Fed to cut rates in July by 25bps as of May 4th!
Oil
Declining inflation data out of Europe and weaker-than-expected China PMI data led to a sell-off in oil and industrial commodities at the start of the week. However, optimism over China’s stimulus, along with hopes for a central bank pause, led to a rebound in commodity prices.
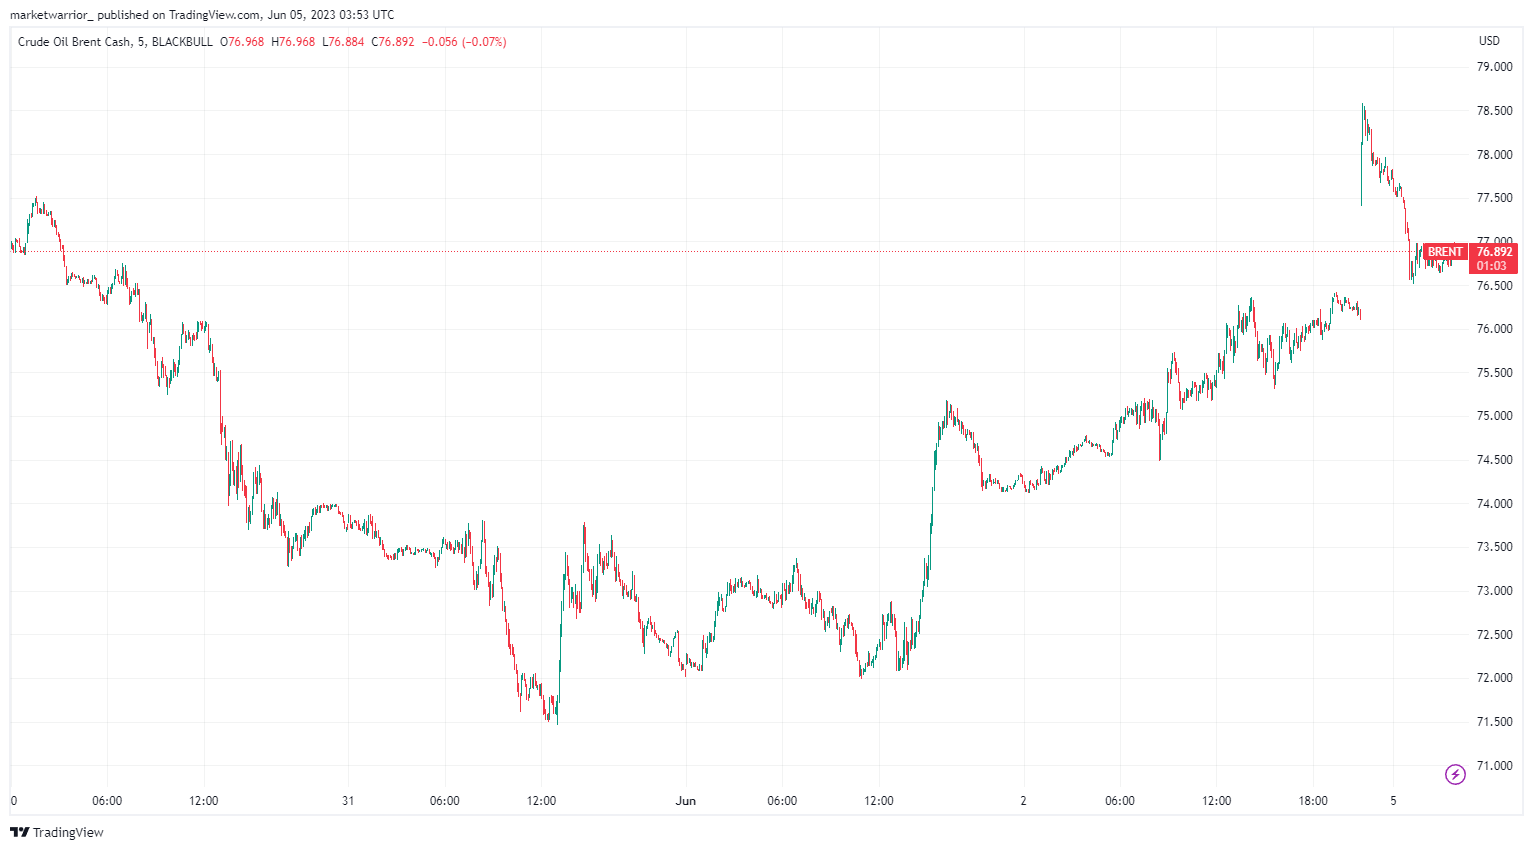
Saudi Arabia said Sunday it would cut 1 million barrels of oil a day as part of a deal between OPEC and its allies after one of the most contentious production meetings in recent years amid concerns over slowing global energy demand. The Saudi announcement came soon after the Organization of the Petroleum Exporting Countries and its Russia-led allies said the group had agreed to stick to current production targets until the end of the year. Sunday’s meeting also came amid growing tensions between Saudi Arabia and Russia—two of the world’s biggest oil producers—over previously agreed-upon production cuts. Russia keeps pumping huge volumes of cheaper crude into the market, undermining Saudi Arabia’s efforts to bolster energy prices, The Wall Street Journal has reported.
Note that Brent crude prices spiked to as high as $78.5/bbl at market open but have since then erased most of the gains.
TGA Accounts
Since the debt ceiling deal is freshly signed by President Biden, the Treasury can officially start to rebuild its coffers, which declined to just $50bn last week. A number of factors ranging from the pace of Treasury’s bill issuance to the type of investors funding these issuances, could lead to meaningful shifts of liquidity and potentially introduce turbulence into short-term markets.
According to most analysts, restoring a healthy balance at the Treasury General Account with the Federal Reserve will require about $750bn of Treasury bill issuance over the next three-four months. The worry is that this will suck liquidity out of the financial system at a time of already-elevated stresses in the banking industry.
Wall Street is divided over the impact of liquidity on the economy. As per DB, investors could rotate their holdings away from the Fed’s overnight reverse repurchase facility (which also drains liquidity) to T-bills, but the impact would be neutral. However, if bank depositors buy treasuries, this will lead to a liquidity withdrawal.
JPMorgan Chase & Co. strategist Nikolaos Panigirtzoglou estimates a flood of Treasuries will compound the effect of QT on stocks and bonds, knocking almost 5% off their combined performance this year. Citigroup Inc. macro strategists offer a similar calculus, showing a median drop of 5.4% in the S&P 500 over two months could follow a liquidity drawdown of such magnitude, and a 37 basis-point jolt for high-yield credit spreads.
Next week
US ISM services data release (June 5th)
Inflation in China (June 9th), wages in Japan (June 9th), and industrial indicators in Germany (June 7th)
Fed is in a blackout period, so we won’t hear from them till the June 14th FOMC meeting