Looking under the hood
What happened last week?

I often get asked by my dad, "How is the market?" and I do my best to explain the complexities of different markets and current concerns, such as a slowdown in growth being priced in. I realized that it might be beneficial to share this information with a wider audience. In this post, I'll explain the recent move of the S&P 500 index, which is often referred to as "the market."
When we see headlines like "markets close higher despite xyz," we might assume that things are good or at least looking optimistic, despite the Fed tightening, a slowdown in manufacturing, high crude oil prices, or any other reason. However, it's important to note that indices such as the S&P 500 have different weights for all companies. So, we should not assume that all companies in the index or the majority of these in the index went up.
S&P 500
The S&P 500 uses a market-cap weighting method, which means it gives a higher percentage allocation to companies with the largest market capitalizations. Here are the top 25 companies within the index along with their weights:
Name (Weight in S&P 500)
APPLE INC(6.74%)
MICROSOFT CORP(5.68%)
ALPHABET INC-CL A(3.60%)
ALPHABET INC-CL C(3.60%)
AMAZON.COM INC(2.75%)
BERKSHIRE HATHAWAY INC-CL B(1.81%)
NVIDIA CORP(1.80%)
TESLA INC(1.53%)
META PLATFORMS INC-CLASS A(1.47%)
UNITEDHEALTH GROUP INC(1.27%)
VISA INC-CLASS A SHARES(1.26%)
EXXON MOBIL CORP(1.24%)
JOHNSON & JOHNSON(1.13%)
WALMART INC(1.08%)
JPMORGAN CHASE & CO(0.99%)
PROCTER & GAMBLE CO/THE(0.94%)
ELI LILLY & CO(0.92%)
MASTERCARD INC - A(0.91%)
CHEVRON CORP(0.85%)
HOME DEPOT INC(0.78%)
MERCK & CO. INC.(0.75%)
ABBVIE INC(0.75%)
COCA-COLA CO/THE(0.72%)
BROADCOM INC(0.69%)
ORACLE CORP(0.67%)
What happened last week?
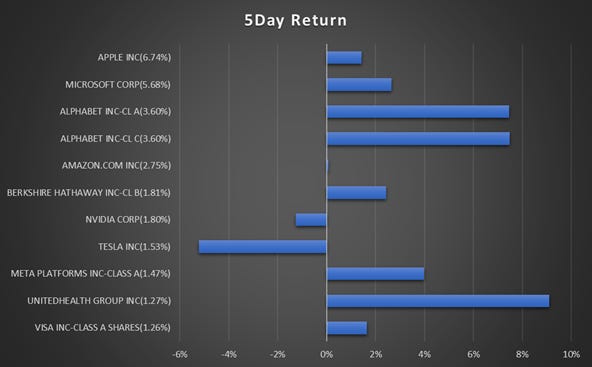
Last week (ending April 6th), the S&P 500 index rose by 1.32%, as banking crisis fears seem to be abating. However, we didn't ignore the miss in PMIs, rise in jobless claims, and other data pointing to a slowdown in growth. The index rose higher because the stocks, especially the mega-cap tech companies, gained, driving the overall index higher. The bars in the chart below show the 5-day return in percentage terms for each company, and the numbers in parentheses show the relative weight of the company on the index. For example, Alphabet gained close to 8% over the week, while it holds a 3.60% weight in the index.
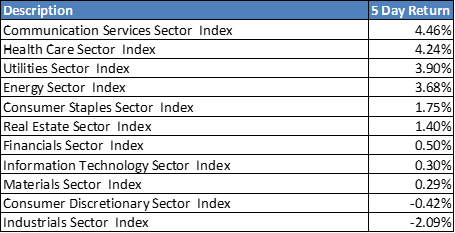
Looking under the hood to see performance by sector level, we see that cyclical sectors – the ones which are more prone to a slowdown in growth, did in-fact underperform compared to the defensives and megacap tech.
Are mega cap tech companies considered safety haven or defensives?
This is probably a topic for another day, but on a high level the answer is no. As Brent Donnelly showed in one of his recent blogs (Friday Speedrun: April 7, 2023) Great companies and great stories can often be terrible investments.
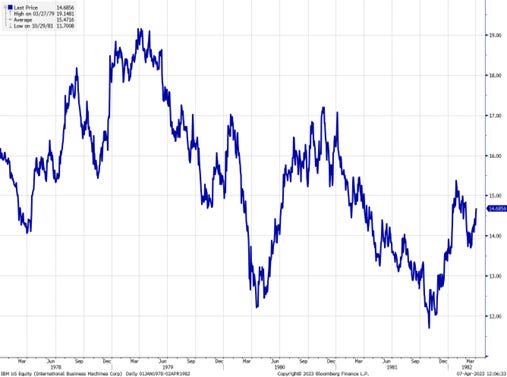
IBM common stock performance was sub-par from 1978 to 1982 despite being a market leader at the time.