
Extreme Greed

The information provided on this blog is for educational and informational purposes only and should not be construed as financial or investment advice. The reader should seek professional financial advice before making any investment decisions based on the information provided on this blog.
Market Update
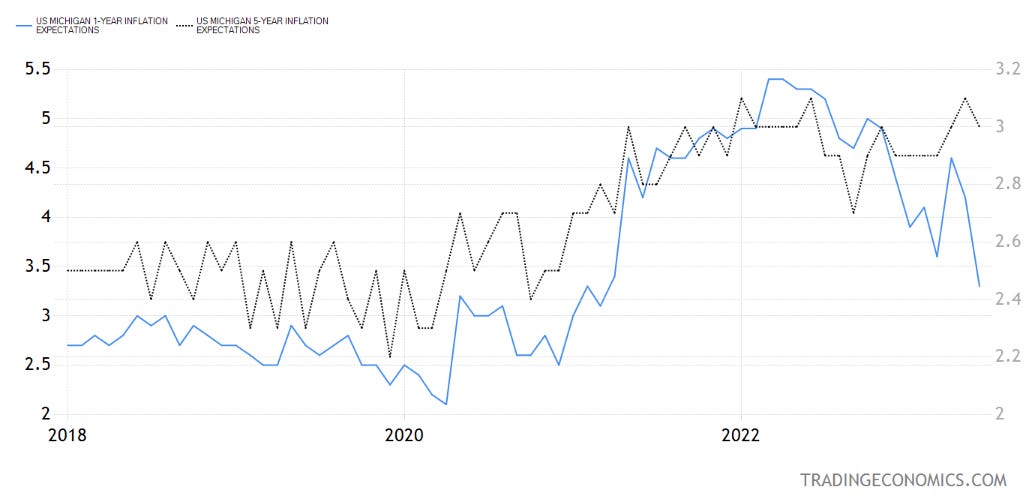
The equity market continued to rally last week despite a hawkish skip by the Fed and another soft weekly jobless claims print. However, on Friday, it failed to close in the green, overlooking the good news from the University of Michigan survey, which showed that the 1-year inflation expectations median plunged in the June preliminary report to 3.3% from 4.2%, much lower than consensus projections (left-hand side of the graph below). Note that the 1-year numbers are more volatile and correlated to energy prices. The more stable 5-10-year median declined more modestly to 3.0% from 3.1% (right-hand side of the graph below). The Sentiment Index rebounded due to improvements in the Index of Consumer Expectations as respondents feel more optimistic about business conditions 1 year and 5 years from now; however, that level remains low by historic standards. If the final report confirms the above, and the trend continues in the coming months, it should be music to the Federal Reserve officials as it would prove that inflation has not become entrenched while the labor market remains resilient, giving a boost to consumer confidence. This would also mean that they could perhaps pause their monetary policy tightening actions and perhaps start cutting rates.
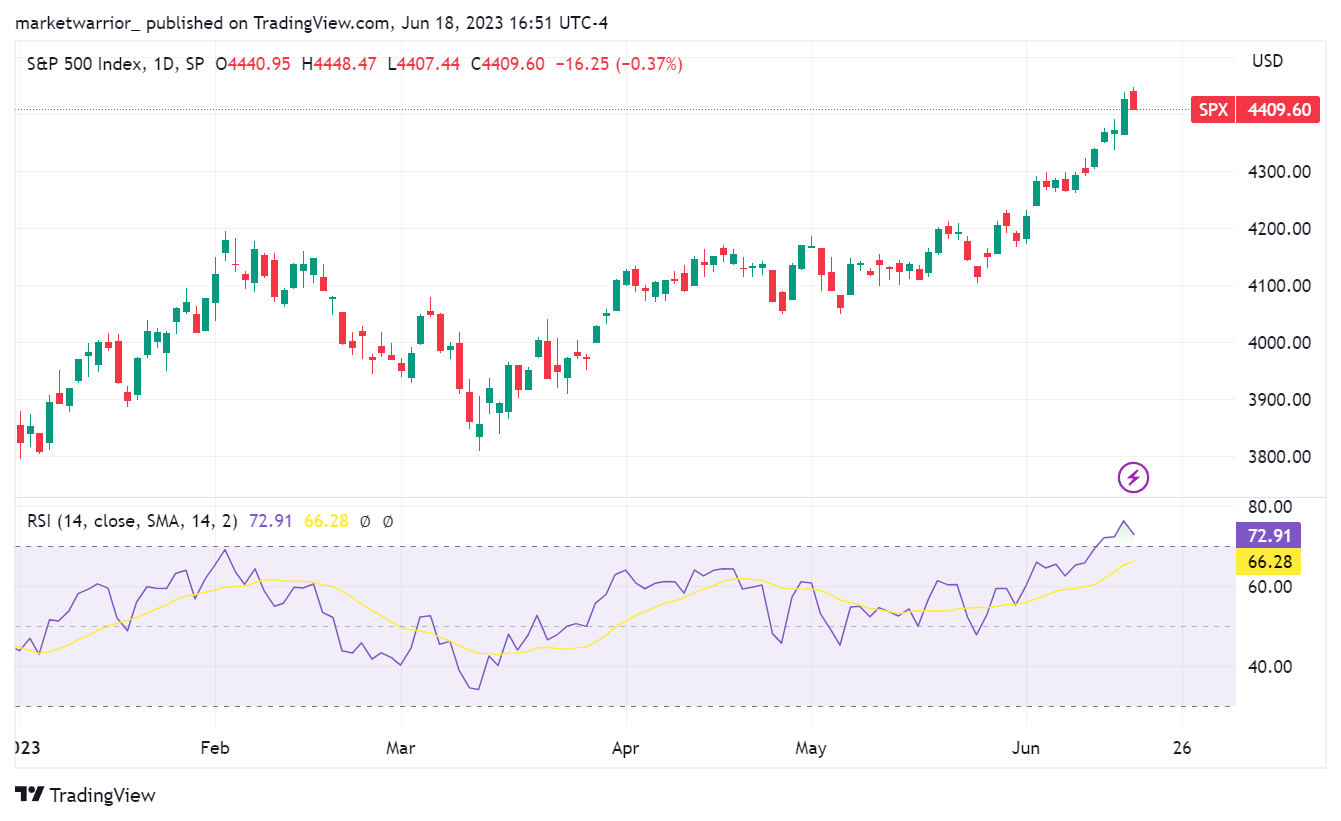
This should have been positive for equities as well, but the S&P and NASDAQ closed 0.4% and 0.7% lower, respectively, on Friday. The equity volatility index, VIX, also fell by 1 point to 13.5 points. I believe stocks failed to go higher on this positive news because the market is arguably overbought. After all, we have seen the S&P 500 climb from ~3,809 points to ~4,409 points (16%) since the SVB failure (March 10th). The lower panel of the chart shows the Relative Strength Index (RSI), a measure that also indicates that the market is overbought.
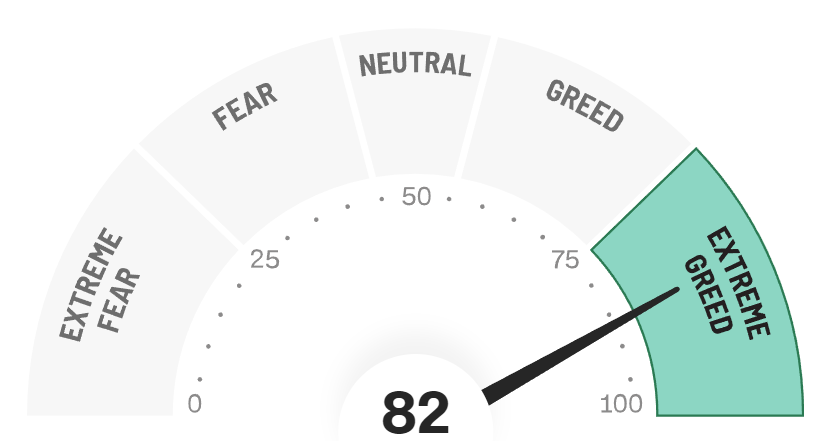
The S&P 500 index also entered a bull market, up over 20% off its low from last October. The question is if this rally will continue or fade from here. When looking at CNN’s Fear and Greed index, it is well in the ‘extreme greed’ zone. The CNN Fear and Greed Index is just one of many sentiment indicators available in the market. It provides a simple way for investors to get a sense of the prevailing sentiment based on indicators such as stock price (momentum, strength, breadth), put/call options activity, junk bond pricing vs. investment grade bond pricing, VIX, and safe haven demand.
In the chart below, 100 shows maximum greed, and 0 shows maximum fear.
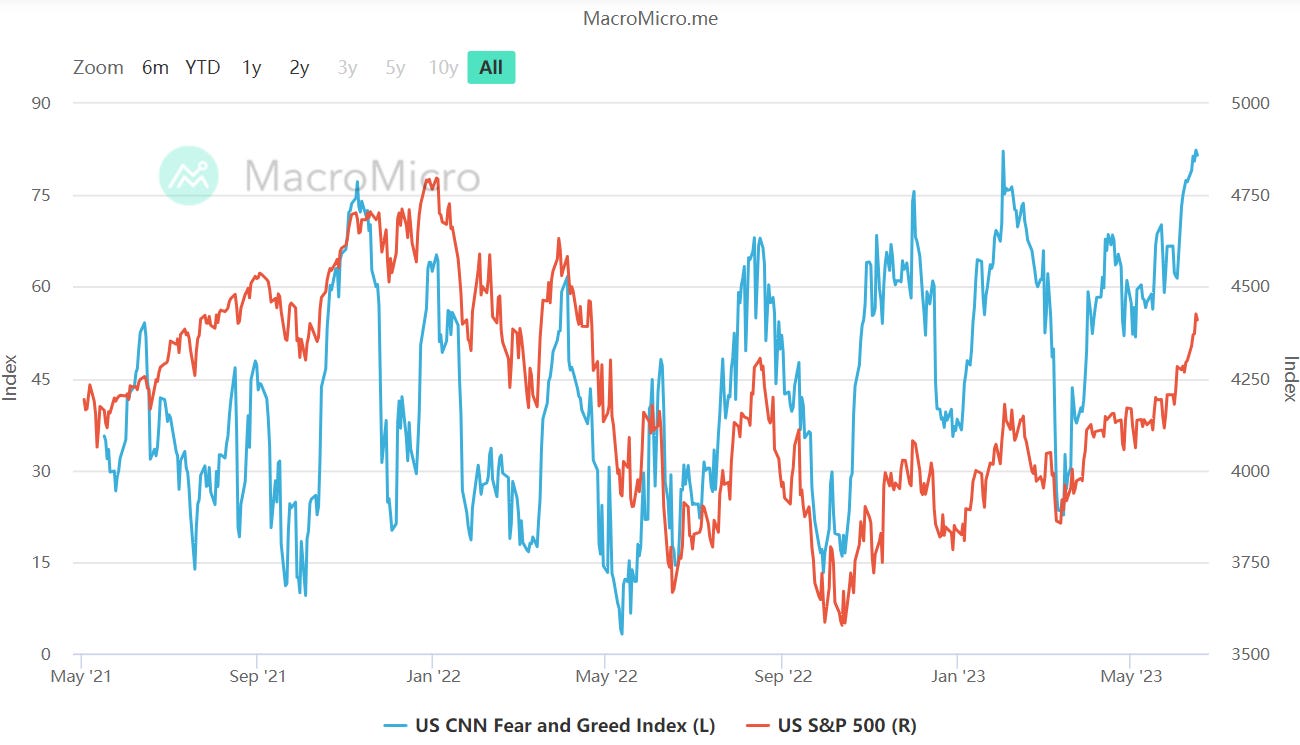
Historically, this has been a good indicator in signaling a top in the market. See the chart below showing some instances where the S&P 500 declined after the Fear/Greed index rose over 75.
Liquidity
Treasury is draining liquidity as it rebuilds its cash balance after the debt ceiling was raised. Contrary to most analysts' expectations, most of the liquidity drain has so far come from money fund reverse repo (RRP) balances, not from bank reserves. However, given Powell said that July will be a ‘live meeting’, and the market is expecting a 25bp hike, I believe we could see money market funds starting to use RRP, and further rebuild in Treasury’s General Account (TGA) could come from bank reserves, which would drain liquidity from the market.
Treasury said in a statement it is targeting an end-of-June cash balance at the Fed of about $425 billion as part of a plan "to gradually rebuild the cash balance over time to a level more consistent with Treasury’s cash balance policy." As of June 15th, it has $250 billion as its closing balance, so it has to raise an additional $175 billion in less than two weeks.
Note that the Fed is draining cash from the financial system through its quantitative tightening program, allowing $95 billion a month of assets - Treasuries and mortgage bonds - to mature from its balance sheet. That must be met with a comparable decline in liabilities, so as the TGA grows, another of those will have to decline, likely either bank reserves or overnight-reverse repurchase agreements.
Across the pond, the European Central Bank is about to test the resilience of the continent's banking industry by making lenders repay about half a trillion euros in cheap pandemic-era loans — in one go.
What Bloomberg Economics Says...
“The repayment of the ECB’s largest TLTRO on June 28 has the potential to add to anxiety about the continent’s banking sector. If any banks were to be shunned in the money markets when they try to replace that official funding, the risk is that confidence in them could be sapped, prompting a flight from investors.”
—David Powell, senior euro-area economist.
Central Banks Update
Federal Reserve in the US
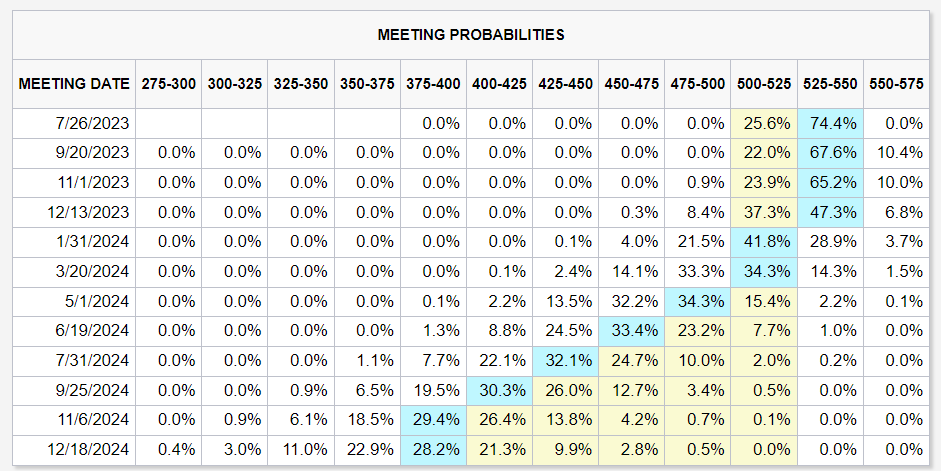
After ten consecutive rate hikes (including four consecutive 75bp hikes last year), officials decided to "skip" hiking in June. A July hike was strongly signaled by Powell when he inadvertently referred to the no-hike June meeting as a "skip" before correcting himself. The market is now expecting a 74.4% chance of a 25bp hike in the July meeting. However, the market is pricing very low odds of any further hikes after July and is pricing a 47% chance that the Fed will keep the rates unchanged in the 5.25-5.50% range. The current pricing also indicates the Fed to deliver its first rate cut by the 1st quarter of next year.
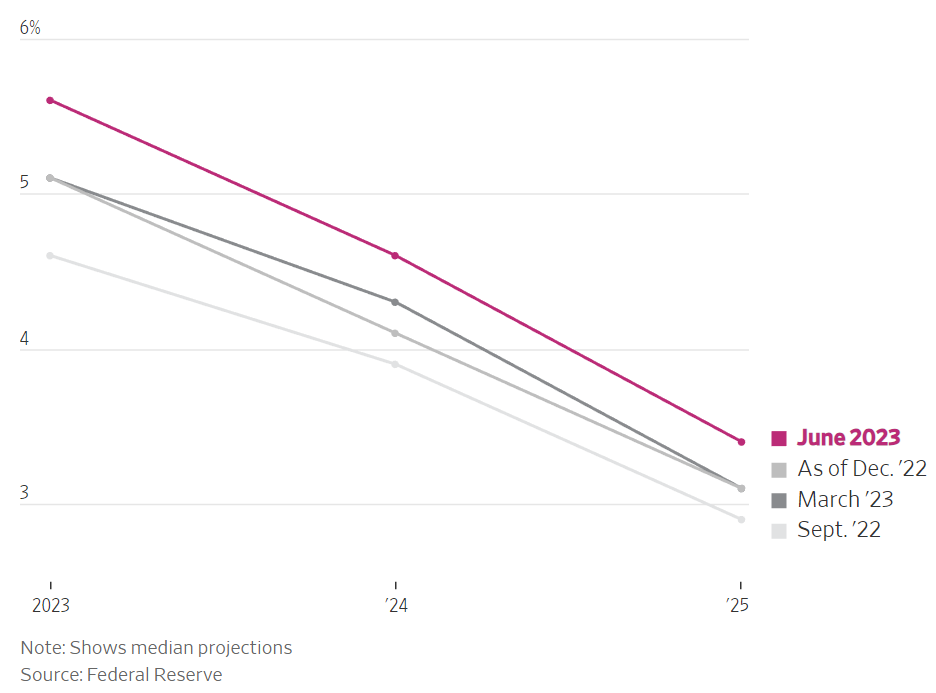
Meanwhile, the Summary of Economic Projections (SEP) shows that the median expectation of a 5.6% Fed Funds rate by the end of 2023, which is one more 25bp hike than the market is pricing in. The Fed also penciled in 4.375% as the Fed funds rate by the end of 2024. These are their current projections, and they would certainly change as we get fresh economic data. Note that Powell has been a realistic and pragmatic leader, where he is not afraid to change his views as the data comes in.
Median Projections of Fed Funds Rate
Powell indicated very strongly that none of the FOMC members indicated a cut in rates for 2023, and that they are slowing their pace of rate increases by not taking any action in June. He suggested moving rates higher at some meetings but not others is the logical next step after slowing from a peak pace of 75bp/meeting last year to 25bp/meeting. This implies a hike at every other meeting, which would mean after July, they would probably skip September, and November could be a live meeting depending on how the data comes in.
Upwardly revised core PCE inflation and GDP growth forecasts in the SEP were also seen as hawkish. The Chair seemed to express clear frustration over the lack of progress on core inflation. He said the Committee wanted to see core inflation moving down "decisively." Many of the previously cited risks, such as credit tightening and the lagged effects of monetary policy, remained. However, the labor market has proved resilient and remains tight, he said. He did underscore that the conditions needed to get inflation down are coming into place. However, he noted more than once the lack of improvement in core inflation.
European Central Bank
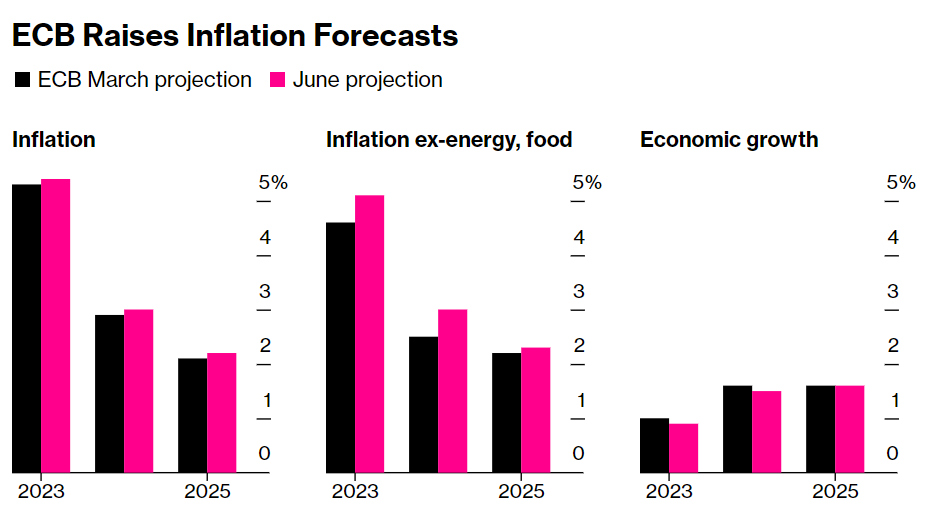
The ECB lifted interest rates by another quarter-point, with President Christine Lagarde describing a further hike in July as "very likely." The deposit rate was raised to 3.5% on Thursday — the highest level in more than two decades. Fresh quarterly projections from the ECB suggested inflation will moderate more slowly than previously envisaged. Economic expansion in the 20-nation euro zone is seen a little weaker following recent data revealing a mild winter recession.
US CPI Data
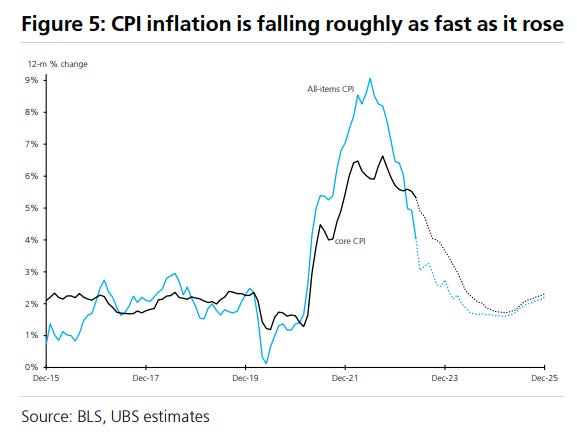
Headline CPI inflation fell to 4.0% in May, less than half of the 9.1% peak in June of last year. Given the base effects from the considerable run-up in gasoline prices last year roll out of the 12-month inflation window, most economists expect further easing next month to around 3%.
Core CPI prices showed another strong increase in May, but the 12-month change edged down and is now at 5.3%, 1.25% below its peak in September. Core inflation has remained stubbornly strong in recent months, though increases have been concentrated in a handful of components. Used vehicle prices and rents (both owners’ equivalent rent and tenants’ rent) together accounted for 36bps of the 44bp core CPI increase in May, roughly similar to April when they accounted for 37bps of the 41bp core CPI increase. Wholesale used car prices have been declining, implying retail used car prices will fall in the June reading. The owner’s equivalent rent and direct rents have slowed from 0.7-0.8% MoM to 0.5-0.6% MoM, and the market expects it to fall further as it is a lagging indicator.
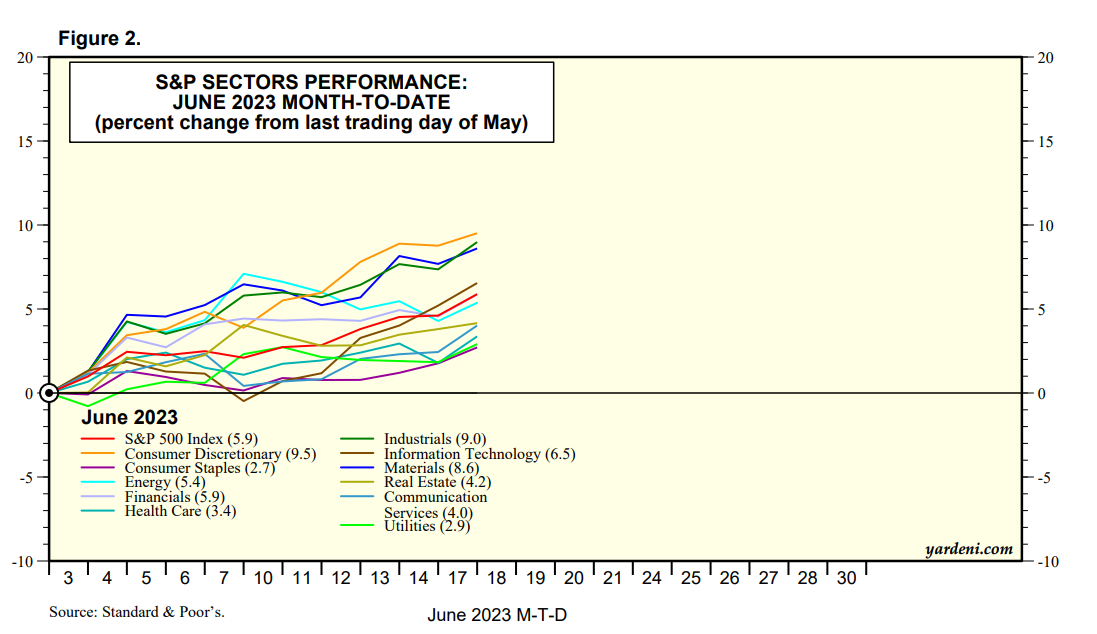
Although this report was encouraging, despite a lack of progress on the core front, investors should be aware that central banks in Canada and Australia were forced to resume their hiking cycle recently after price pressures picked up recently. Besides, the equity market has considerably rallied on the back of the expectations of disinflation, and risk-reward doesn't look great here. However, the improving breadth (i.e., more sectors and stocks joining the rally) is a positive sign and could propel stocks higher absent any sentiment shift.
Next Week
Powell’s testimony on the House (Wednesday) and Senate (Thursday)
Housing data
Weekly Jobless Claims
Chicago Fed National Activity Index
S&P Manufacturing and Services PMI
Fed speak (Bullard, Williams, Goolsbee, Waller, Bowman, Barkin, Mester)