
Another good week for Soft Landing narrative
Not so good for risk assets though

After a relentless rally in equity and credit markets over the last several weeks, risk assets took a dive to start August amid a significant increase in long-dated Treasury yields.

What Happened Last Week?
The S&P 500 dropped from a year-to-date high of 4,588pts to close on Friday at 4,478. This 2.4% drop came amid incremental positive data from a soft landing perspective, however, a sharp rise in Treasury bond yields added pressure on the valuations. The Price/Earnings (P/E) ratio is a common barometer for stock valuations, and for the S&P 500, it is currently 20.4x, which is above the 5-year average (18.6x) and above the 10-year average (17.4x).
The below chart (orange line) shows that the yields on the 10-year Treasuries touched 4.20% before declining to 4.03% with a softer-than-expected 187k jobs added in July in Friday employment data. However, since July 19th, the 10-year Treasury yield has increased by 28bps!

The yields on the 30-year Treasury bonds have also increased by 36bps since July 19th as we can see from the chart below
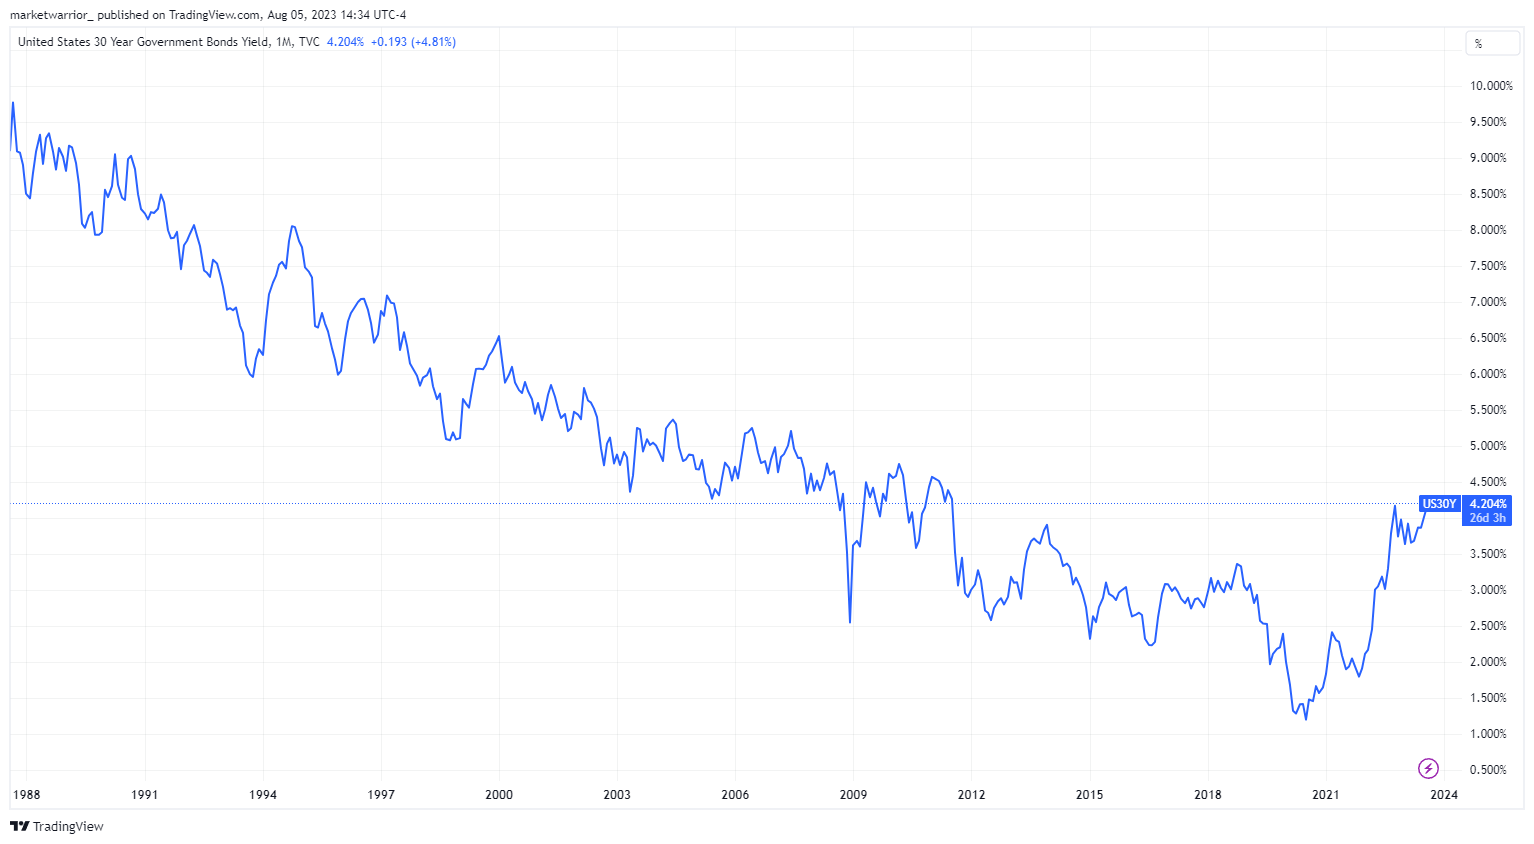
Why did the Treasury bond yields increase significantly in the long end?
It has been driven in part by the announced increase in Treasury note/bond issuance in the current quarter. The Treasury plans to sell $103 billion of longer-term securities at its so-called quarterly refunding auctions next week, an amount slightly larger than most dealers had expected. These latest financing estimates point to a worsening fiscal profile. The Treasury forecasts private borrowing of $1trn in Q3 alone; only during the COVID-19 pandemic did the Treasury borrow more in a quarter (Q2 20: $2.7trn). For the full fiscal year, the Treasury estimates private borrowing at $2.69trn. Dive deeper
The above prompted Fitch Ratings to cut the government’s AAA credit rating to AA+. Although the downgrade surprised the market, it should have no impact on markets in the near term as it doesn’t impact any BASEL or Repo documents from a collateral perspective. Ie we won’t see a forced selling of US treasuries, as funds have a broad mandate to hold them. In downgrading the US sovereign rating, Fitch noted its concern about the growing debt burden and erosion of governance. From a medium-term perspective, the downgrade was another reminder for the market about the deteriorating fiscal picture of the US and could lead to higher US Treasury yields in the absence of a major buyer of duration (Central banks).
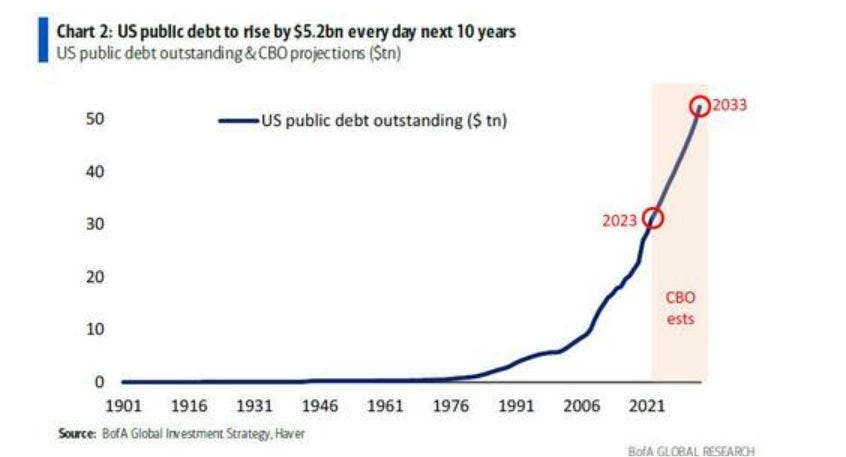
Calling it this week's "biggest picture", Bank of America strategist writes that between the 1st US debt downgrade in Aug'11 and the second on this week (Aug'23) US sovereign debt is up $18 trillion to $30 trillion (and it's all uphill from here: the CBO predicts that US debt will raise to $52 trillion in one decade, by 2033), or rising by $5.2 billion every day for the next 10 years.

How did the US Economic data support a soft-landing scenario?
Non-farm payrolls report showed a slowing job growth (187k jobs added compared to expectations of 200k; the previous month also revised to 185k from 209k) along with a decline in ‘average hours worked’ (34.3 hours from 34.4 hours) but a decline in the unemployment rate (3.5% from 3.6%) and persistently strong wage growth (Average hourly earnings were unchanged at 4.4%) shows a very nuanced picture for the labor market.
Job growth of 187k in July, while softer than the market expected, was the focus of many market participants, as it shows the economy still growing albeit at a slower pace. However, I am more concerned about the ‘Average Hours Worked’ component as it is a good leading indicator for the economy. Typically, if companies feel good about the demand picture then they have existing workers put in more hours through overtime before hiring more people. On the other hand, if they see demand deteriorating, they start cutting hours for existing employees before laying them off. I think the memory of the pandemic when companies were having a hard time finding workers has led to labor hoarding. As we can see from the below graph, the ‘Average hours worked’ declined once again to 34.3 hours – so it is worth watching this component as it might give us hints of widespread job losses before they happen. Bloomberg wrote about this in early July

Other data released this week showed that job openings fell to 9.58million in June, with the ratio of openings to unemployed workers remaining at 1.6:1. But high-frequency data on job postings that track well with the official JOLTS data suggest openings remaining elevated, moving sideways or even somewhat higher in July.
The initial jobless claims also reflect a tight labor market as fewer people are filling for weekly jobless claims


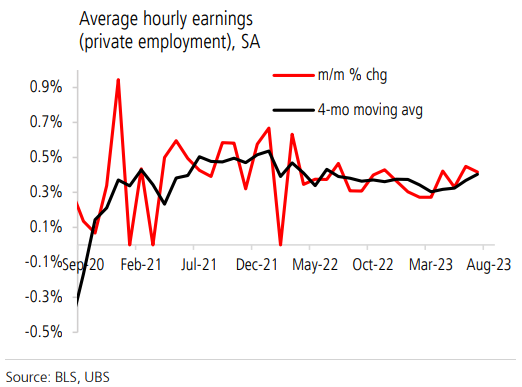
Wage growth (average hourly earnings) has slowed but continues to run at rates above what is consistent with 2% price inflation. Recent data showed a solid 0.42%MoM increase in average hourly earnings in July and upward revisions to 0.45% in June. Next Thursday’s release of the Atlanta Fed’s wage tracker, will give us additional data points on this front.
Although ISM Manufacturing index remains in contractionary territory, new orders which is a leading indicator of the index show a bottoming of the index, which is a good sign from a soft landing perspective as it shows activity picking up in manufacturing.
The ISM non-manufacturing composite index fell 1.2 points to 52.7, below consensus (53.1) expectations, but remains in expansionary territory (above 50).

Oil Markets
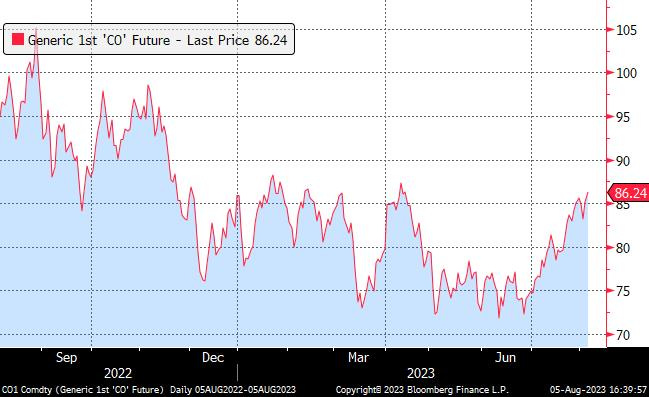
Brent oil prices closed above $86 per barrel despite weakness in markets elsewhere. This follows a July in which Brent surged 14%, the strongest monthly gain since January 2022. The move came after Saudi Arabia and Russia announced an extension of their production cuts on Thursday. Added momentum came from US data showing the largest-ever drawdown of crude inventories last week, with holdings contracting by more than 17 million barrels. As per UBS, the supply-demand picture is likely to be a market deficit of around 2mbpd in July and August, versus around 0.7mbpd in June. The rise in oil prices could make Fed’s job tougher as headline inflation will start reflecting the impact of higher prices in the coming months.
Key Takeaways
Although the near-term recession is unlikely, risk markets appeared stretched so a consolidation last week in major equity indices and credit markets was not surprising.
Treasury issuance and a Fitch downgrade was an important reminder of the deterioration in US fiscal balances, and markets reacted by selling US Treasuries.
A tight labor market, rising house prices, rebounding activity, and higher oil prices point to upside risks to inflation which would imply higher for longer policy rates.
Labor union demands and contract renegotiations could be another source of wage inflation as UAW is pressing he Detroit car companies to give its factory workers a 40% pay hike in the next labor contract
Next week
The focus for next week will be on the US CPI report with consensus expectations of a headline increase of 0.2% MoM (unchanged from previous month) and 3.3% YoY (from 3% last month). The core measures (which exclude food and energy) are expected to rise by 0.2% MoM and 4.8% YoY, both unchanged compared to the previous month.
Other interesting articles
Apollo chief warns private equity industry ‘in retreat’ as rates rise (FT)
Goldman upgrades oil demand outlook as market tempers growth pessimism (Reuters)
Food-Delivery Workers in New York City Launch Labor Fight ‘Just to Survive’ (WSJ)
UAW Demands 40% Pay Hike in Labor Talks With Detroit Automakers (WSJ)
BofA Clients Turn Cautious, Flee From Stocks on Recession Risks (Bloomberg)